HI,
As long as you can read and write, and move and see, you can learn.
You need to learn so you will be able to survive and make sense of this world.
I want to be able to say something optimistic, but I can't.
I think it's time to sell off and cash in all profits. asap
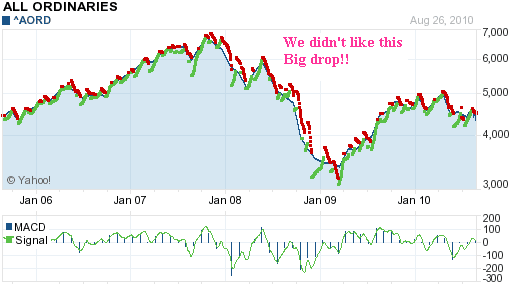
If you go to www.google.com/finance, and search the S&P200, do a technical KDJ analysis, it showed on the J, on friday about 1pm, that the
A ords is oversold. it was above the 80. It's a sign to sell and not buy. Just
one of many signs.
(google finance is a great free tool for using technical analysis. Learn by doing there, but go via internet explorer. Mozilla somehow doesn't allow you to do the technical analysis, neither does Yahoo finance. )
I think the Global economy is in serious trouble.
I hope I'm wrong, I really hope so
The A ords closed at 4875 on Friday 28.1.11 with a drop of 34 points, all
markets dropped.(the asx S&P200 dropped too. its about 100 points less.
I don't think you can dismiss these drops as a correction after 8 weeks of aus
rises. I don't think you can blame the riots in Egypt, or the closure of
more banks in the USA this week.
My thoughts are it is a reflection of pessimism and the revelations that
arose from the GFC this week that the regulators and
top management do not actually know what caused the GFC or how to fix, or
even how to avoid it in future.
google recent GFC investigations 24.1.2011
http://www.nytimes.com/2011/01/28/business/economy/28inquiry.html
and see 1929 data below.
US market in Review: World market Crashed due to the Political unrest in
Egypt
29 January 2011 ref
http://galaxystocks.com/4595/sector-summary/us-market-in-review-world-market-crashed-due-to-the-political-unrest-in-egypt/
S&P 500 had it's biggest decline in the history of since August, US economy
faced the challenging among the trade due to the political uncertainty in
Egypt and huge fell of Ford motor and Amazon shares.
Three major NASDAQ, S&P 500 and Dow Jones indices were attempted to stable
the market but failed to perform well and lost the investor confidence
because investor are looking for safety for their investment. Even no single
indices were closed above the trend line during last session of trade.
Dow Jones Industrial Average declined -1.39% or -166.13 points to 11,823.70
however it exhibited a positive quarterly performance of +248.16 points or
2.14% which continued to remain up for half year with +1325.82 points or
12.63% and YTD performance firmed at +246.19 points or 2.13%.
S&P 500 INDEX, RTH declined -1.79% or -23.20 points to 1,276.34 however it
exhibited a positive quarterly performance of +17.83 points or 1.42% which
continued to remain up for half year with +170.21 points or 15.39% and YTD
performance firmed at +18.7 points or 1.49%.
NASDAQ Composite declined -2.48% or -68.39 points to 2,686.89 however it
exhibited a positive quarterly performance of +179.52 points or 7.16% which
continued to remain up for half year with +422.33points or 18.65% and YTD
performance firmed at +34.02 points or 1.28%.
so what can you do?
Make your own MOPI - MY own personal Indicator.
I/we started trading just before the Global financial crisis (GFC) in August
2007.
The A Ord was at 6830. (you can find the historical figures on the
www.asx.com.au)
I think of the scale like stairs, 1 - 9 NINE BEING the top without a
landing. step 5 is good, steps 6 - 7 excellent. 8-9 it may be about to
burst. But steps 3-4 require more research and much caution.
In 2007 we were going up fast toward a bust, it was rising too sharply and
too high.
In January 2008 there were huge unexpected problems in the USA, and in July
2009 it fell to 3111.
It has been up and down since. Halfway between both extremes is my midpoint.
You may not agree with this time frame so make your own YOPI - (Your own
personal indicator.. (MOPI =My Own personal Indicator.)
To calculate your own YOPI take the period you think is a good reflection of
the global market then the record the highest daily result less the lowest.
divide by 2 and add the result to the lowest. Note the historical figures
will change so you need to re do your YOPI every 3-6 months.
My Mopi.
Since 1.07.2007 The highest UPPER was 6853. The LOWEST 3111. 1871 on top of
the lowest of 3111= 4982
Right now it is BELOW at 4800 .
IT'S NOT ABOVE MY MID POINT. THE MARKET is still shaky.
My current MOPI is 4970. That is my worry line. That's a Decision time.
I take in all the indications on the chart and finally look at the market
points, and deduct my MOPI. If the result is above my 4962 points, I'm
happy. Right now its not.
Here's some sobering thoughts . ref
http://en.wikipedia.org/wiki/Wall_Street_Crash_of_1929
" Anyone who bought stocks in mid-1929 and held onto them saw most of his or
her adult life pass by before getting back to even. "
-Richard M. Salsman[3]
The Roaring Twenties, the decade that led up to the Crash,[4] was a time of
wealth and excess. Despite caution of the dangers of speculation, many
believed that the market could sustain high price levels. Shortly before the
crash, economist Irving Fisher famously proclaimed, "Stock prices have
reached what looks like a permanently high plateau."[5] However, the
optimism and financial gains of the great bull market were shattered on
"Black Tuesday", October 29, 1929, when share prices on the New York Stock
Exchange (NYSE) collapsed. Stock prices plummeted on that day, and continued
to fall at an unprecedented rate for a full month.[6]
The October 1929 crash came during a period of declining real estate values
in the United States (which peaked in 1925)[citation needed] near the
beginning of a chain of events that led to the Great Depression, a period of
economic decline in the industrialized nations.
The October 1929 crash came during a period of declining real estate values
in the United States (which peaked in 1925)[citation needed] near the
beginning of a chain of events that led to the Great Depression, a period of
economic decline in the industrialized nations.
In the days leading up to "Black Thursday" (called "Black Friday" in Europe
due to the time difference) and "Black Tuesday" the following week, the
market was severely unstable. Periods of selling and high volumes of trading
were interspersed with brief periods of rising prices and recovery.
Economist and author Jude Wanniski later correlated these swings with the
prospects for passage of the Smoot-Hawley Tariff Act, which was then being
debated in Congress.[7] After the crash, the Dow Jones Industrial Average
(DJIA) partially recovered in November-December 1929 and early 1930, only to
reverse and crash again, reaching a low point of the great bear market in
1932. On July 8, 1932, the Dow reached its lowest level of the 20th century
and did not return to pre-1929 levels until November 1954.[8][9]
Meg
Remember we are not financial advisors.. Sampson management Services (SMS) educate and inform only...We are Assett Management Consultants- we teach you about risk and how to measure that risk according to the international standards on Quality, Environment, OHS, and Risk management in an integrated approach. Ref standards: AS/NZS/ISO 9001, AS/NZS/ISO 14001, AS/NZS/ISO 4804, AS/NZS/ISO 4360.
Megamoneybox address is http://Megamoneybox.blogspot.com.au We try to help you earn money on the internet.We give free share trading tips. We aim to educate and enthuse. We are in Australia in the land of the Sun. We are asset management and risk consultants, are not financial advisors. You Trade at your own risk. We could be wrong. So do your homework. Go to our other blogs to de stress. We are not big risk takers. We asses, investigate, analyse and then decide.